There Is No Holy Grail
Why no single indicator works everywhere, the difference between a tool and a signal, leading versus lagging, and how to judge any indicator honestly — including ours.
The Thing Everyone Is Looking For Does Not Exist
Almost every trader starts by looking for the same thing: the one indicator that works on every timeframe, in every condition, on every instrument. It does not exist, and the search for it costs people years. This is not an anti-indicator position — indicators can absolutely be used successfully, and most serious traders have tested a great many of them, finding some genuinely decent and some that looked like the missing piece for a while. The problem is not the tools. It is what people expect the tools to do. An indicator is a transformation of price and volume data into a more readable form. It cannot contain information that was not already in the data, and no arrangement of moving averages will tell you something the price series did not already know.
Tools, Not Signals
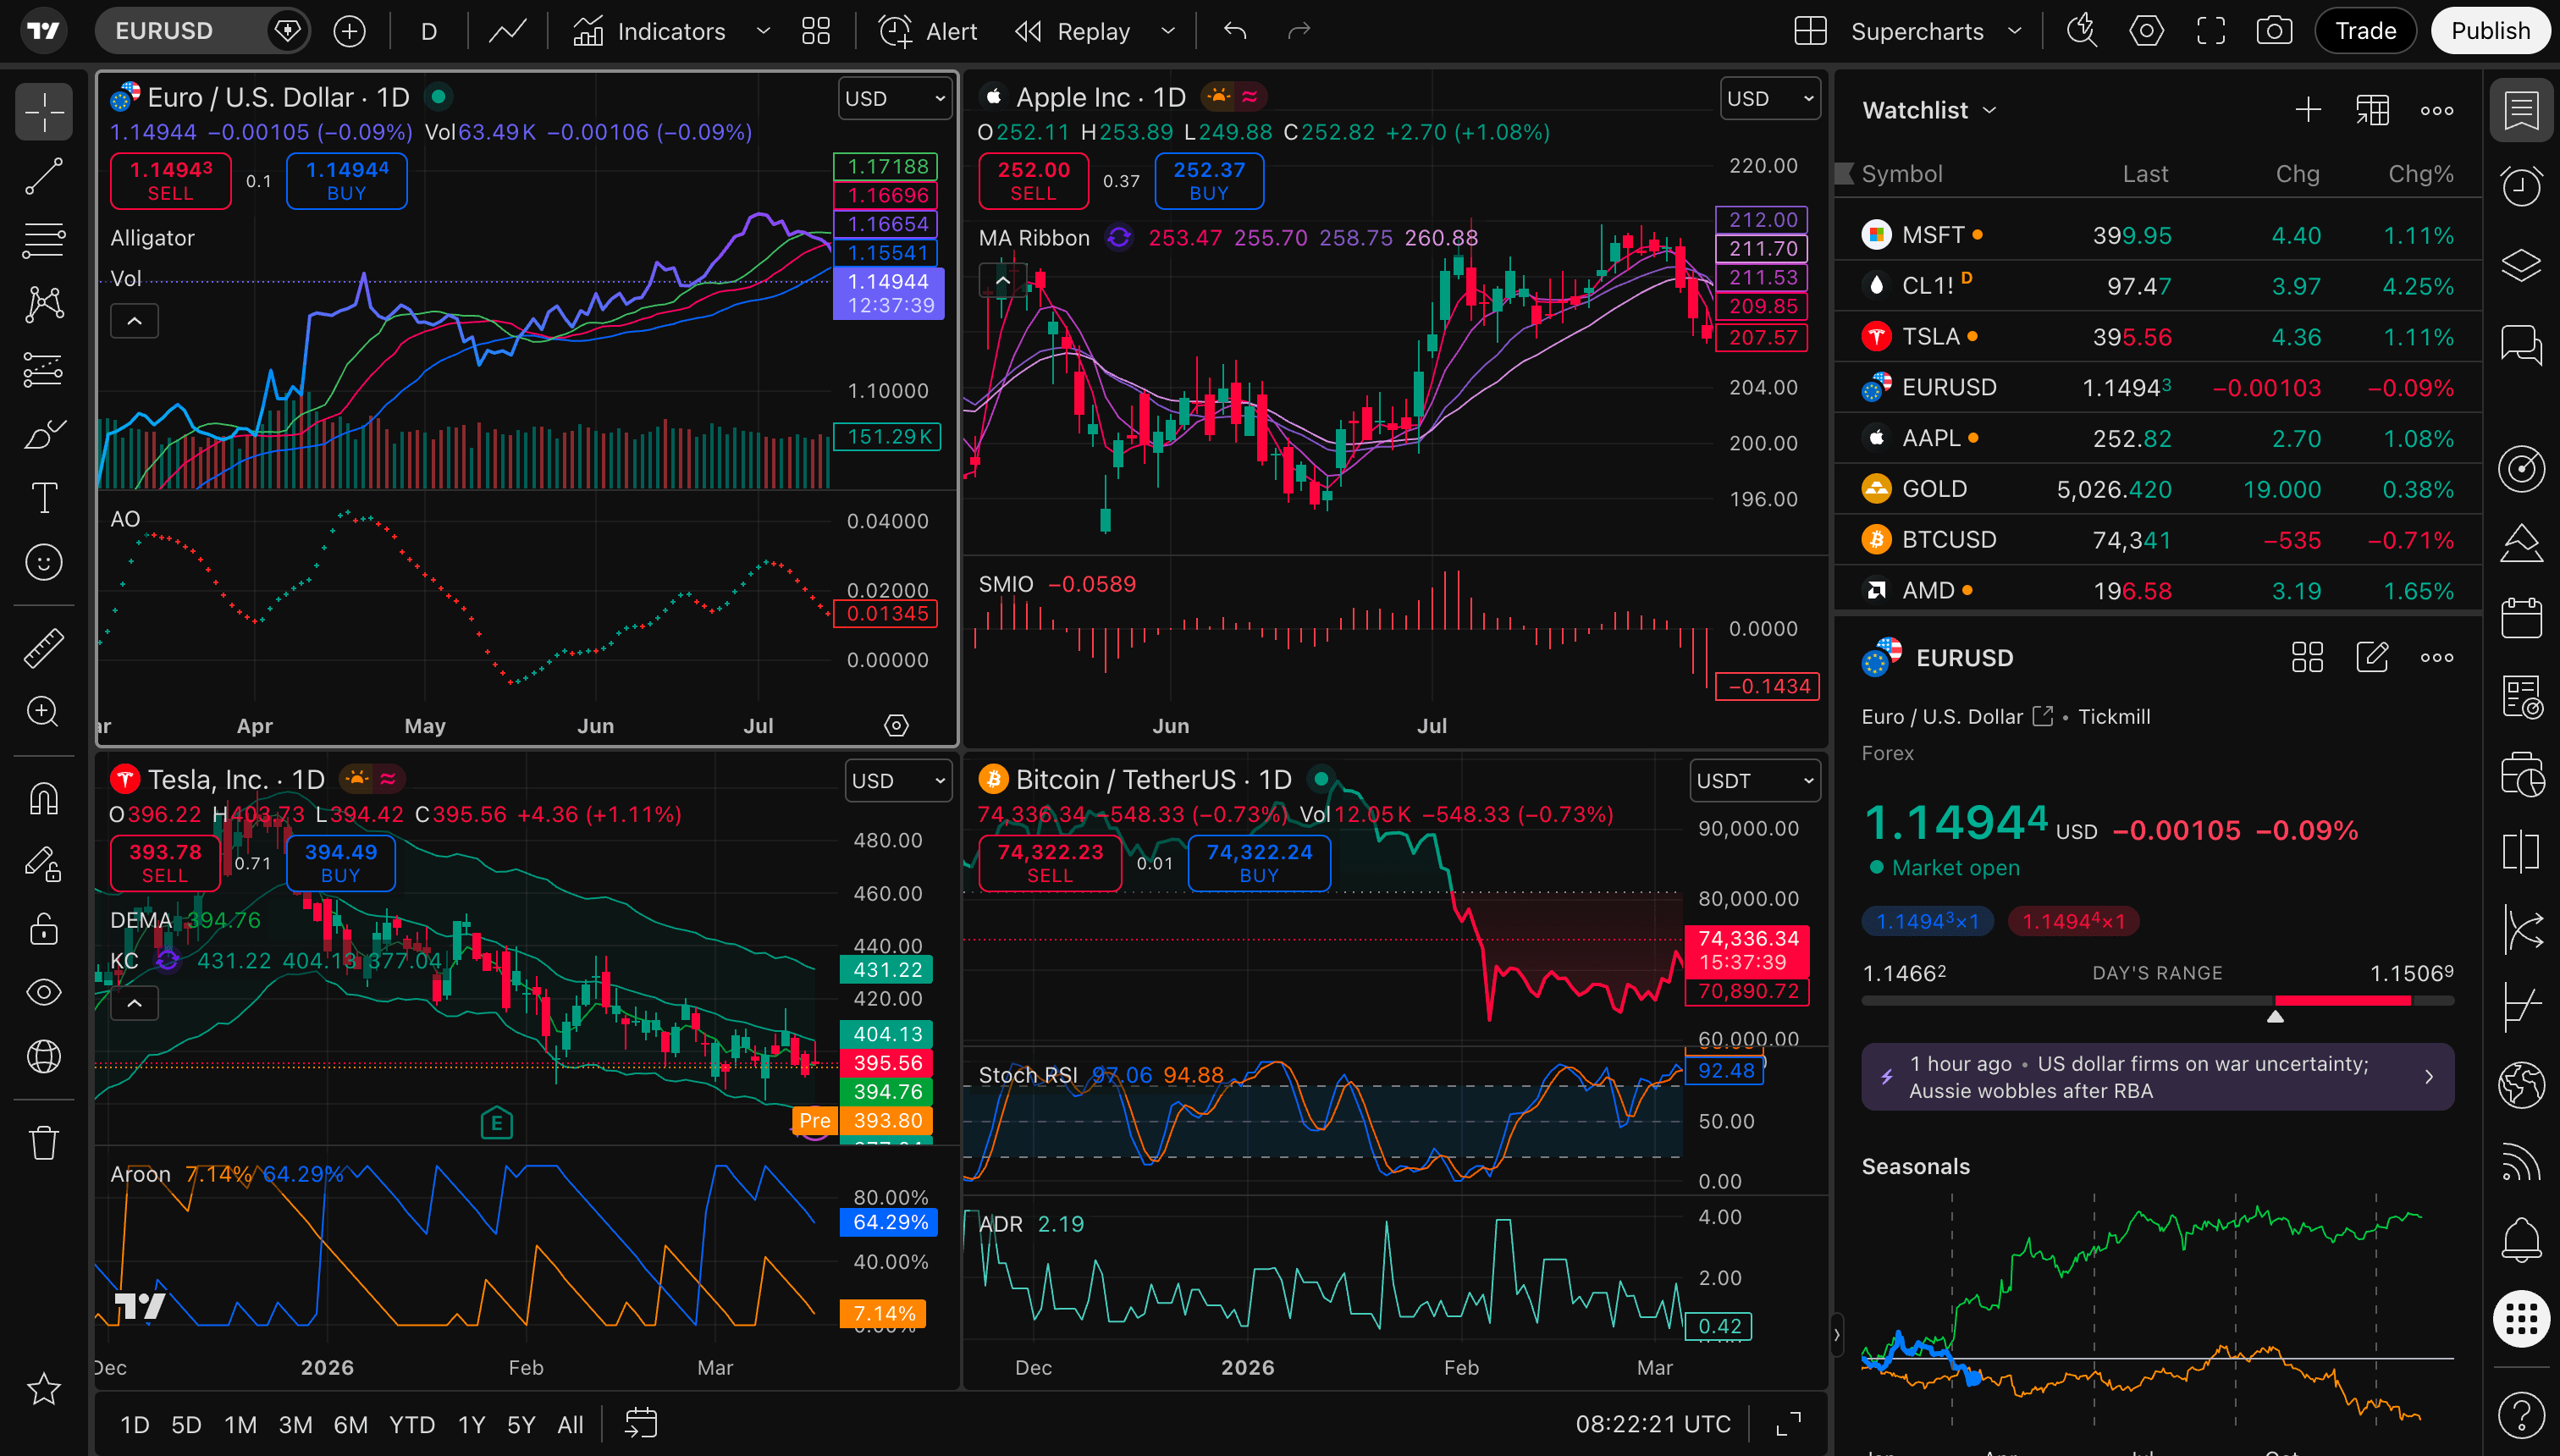
The biggest mistake with indicators is reliance. People use them in isolation, treating them as signals rather than tools: they wait for a cross, a green dot, or a line touching 'oversold', and they fire. No context, no structure, no edge. Then, when that does not work, they add a second indicator, and a third, and a sixth, on the assumption that more must be better. In reality they are adding noise, contradiction and decision fatigue, and they end up with a chart that offers a reason to do anything at any moment. If your screen looks like a circuit board, something has gone wrong. The useful question about any indicator is not whether it works but what it is measuring and under what conditions that measurement is informative. An oscillator reading 'oversold' in a strong downtrend is not giving you a buy signal; it is correctly reporting that price has fallen a lot, which you could see.

Free charts, alerts, and screeners for every asset discussed on this page. Used by 50M+ traders.
Leading and Lagging
Indicators divide broadly into two types and confusing them causes real damage. Leading indicators attempt to anticipate where price might go, typically by measuring the rate of change or the extremity of a recent move — oscillators like RSI and stochastics live here. They fire early, which means they fire often, and a large share of those early signals are wrong; in a trending market they will tell you to fade the trend repeatedly. Lagging indicators describe what has already been established, with moving averages the obvious example. They are more reliable precisely because they wait for confirmation, and the price of that reliability is that you are late. Neither type is better. The mistake is expecting a leading indicator to be reliable or a lagging one to be timely, and then abandoning it when it behaves exactly as its construction guarantees it will.
| Leading | Lagging | |
|---|---|---|
| What it does | Anticipates a possible turn | Confirms an established move |
| Examples | RSI, stochastics, rate of change | Moving averages, MACD line crosses |
| Strength | Early | Reliable |
| Weakness | Frequently wrong | Always late |
| Fails worst in | Strong trends — fades them repeatedly | Choppy ranges — whipsaws |
| Honest use | A prompt to look, not to act | A filter on what you already decided |
What Actually Makes an Indicator Useful
Indicators work when they sit inside everything else rather than replacing it: market context, the current condition, structure, analysis across more than one timeframe, volume, risk management, and emotional control. Ignore those and rely on the indicator alone and you are flipping a coin at best, and paying spread for the privilege. The practical version of this is that an indicator should narrow your attention rather than make your decision. It tells you which charts to look at and which side to consider; structure tells you where to enter and where you are wrong; risk management tells you how much. Used that way, quite ordinary indicators become useful, and the number you need drops sharply — most traders who eventually find consistency end up with fewer things on the screen than they started with, not more.
How to Judge an Indicator Honestly
Three questions settle almost any claim made about an indicator, and they are the same three that settle claims about chart patterns. How many occurrences are in the sample? What exactly counts as a signal, written down before the testing started? And what would have happened over the same horizon without the indicator at all? That third one does most of the work, because an indicator that wins 62% of the time sounds compelling until you discover the instrument rose 62% of the time regardless. Most marketing material omits the baseline, and a surprising amount of published research does too. Chart examples are not evidence, however striking: anyone can find five charts where anything worked. What matters is the distribution across every occurrence, compared against doing nothing.
This Applies to the Alphameter Too
It would be inconsistent to write all of the above on a site that publishes an indicator without turning the same lens on our own. The Alphameter is a composite of six cross-asset signals, and it is a tool rather than an oracle. Its validated use is rotation between risk assets and defensives, it spent 2013 to 2019 underperforming a plain 60/40 portfolio, it produces risk-off warnings that never become crises, and its per-asset rankings in risk-off conditions did not survive our own stability testing. We publish those limitations because an indicator whose weaknesses you do not know is an indicator you will misuse — and because a tool honestly described is more useful than a holy grail dishonestly sold. Use it for what it measures: whether cross-asset risk appetite is expanding or contracting. For where to enter, what to own, and how much, you need the rest of your process.
Free charts, alerts, and screeners for every asset discussed on this page. Used by 50M+ traders.
Frequently Asked Questions
Do trading indicators actually work?▼
They work as tools when used within a process that also includes market context, structure, multi-timeframe analysis, volume, risk management and emotional control. Used in isolation as buy and sell signals, they are close to a coin flip with transaction costs attached.
What is the difference between leading and lagging indicators?▼
Leading indicators try to anticipate a turn and therefore fire early and often, with many false signals — they fade trends badly. Lagging indicators confirm what has already happened, making them more reliable but always late. Neither is better; expecting either to behave like the other is the actual mistake.
How many indicators should I use?▼
Fewer than you think. Stacking indicators adds noise, contradiction and decision fatigue rather than confirmation, because most of them are transformations of the same price data. Traders who find consistency generally end up with less on the screen than they started with.
Is there a best indicator for trading?▼
No. There is no indicator that works across every timeframe, condition and instrument, and searching for one costs most traders years. Indicators cannot contain information that is not already in the price and volume data they are computed from.
Related Topics
Track These Indicators Live
The Alphameter synthesizes six macro indicators into a single regime score — updated daily. See the current reading and full indicator breakdown on the dashboard.
Get notified when the market regime changes
Regime alerts + weekly macro brief. Unsubscribe anytime.